Creating and Exploring a Q Knowledge Graph
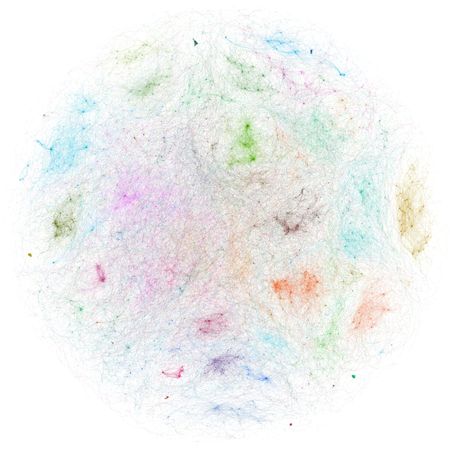
Organisations today hold more data than ever, but most of the value does not come from the individual records, but in the connections between them. Which individuals sit behind a cluster of businesses, forming shell networks? Which accounts move money between each other to hide a fraud ring? These are network questions, and answering them means treating your resolved data as a graph. Traditional graph databases work well with small graphs, but they tend to struggle once a network grows to hundreds of millions - or billions - of nodes and edges, which is exactly the scale of real data problems organisations try to solve. That's exactly what Q Knowledge Graph (QKG) is for. It’s built to run algorithms and perform analytics efficiently, effectively unlocking graph data science at scale. In this article we'll cover the why, the what, and the how of building your knowledge graph and introduce how to explore it to find insights. Background Quantexa's Entity Resolution turns messy, scattered data into a connected network of entities. You can bring together internal customer records, corporate registry and sanctions lists, and resolve these records into entities - for example business, individual, address, account - linked through the relationships that connect them in the real world: shareholdings, ownership, and transactions between accounts. The result is a single source of truth for your data, which is also enormous - often millions or billions of nodes and edges. That scale is exactly why a Knowledge Graph is usually the next step for many analytical applications. A knowledge graph is a type of graph that shows the relationships between different pieces of data. It represents a network of real world entities and the relationships between them. What is a Q Knowledge Graph? Q Knowledge Graph is our in-house graph processing engine and framework, designed to query and analyse knowledge graphs generated from Quantexa. It offers a network science friendly Python API and native support for Graph Machine Learning, all running very efficiently at scale thanks to a sparse-matrix backend built on distributed linear algebra. A node is typically a resolved Quantexa entity - an individual, a business, an account, a telephone - or a document. Each node type carries its own features (numeric or string attributes). Relationships are typed and directed. Edges are written as head-relationship-tail triplets. individual-owner-account and account-txn-account are two different relationship types, and QKG keeps them distinct. In code, that edge is a first-class object: import qknowledgegraph as qkg qkg.Triplet("individual", "owner", "account") # (head, relationship, tail) qkg.Triplet.from_string("individual-owner-account") # the same, as a string The full set of node types and relationship types represents the graph's schema, which is called the metagraph - more on that when we start exploring. Why use QKG? QKG is built specifically for graph analytics on Quantexa resolved data, at scale, and without leaving the Python ecosystem. A few things it gives you: Network science on Quantexa data, without leaving Python. You can run complex graph operations - such as centrality, ego network expansion, cycle detection and more - directly against your resolved entities. A bridge to graph machine learning. QKG can shape neighborhoods and hand them straight to PyTorch Geometric to train GNN models. Scale. Sparse matrices plus Spark for the heavy joins mean the same code works on a toy graph and on a production-sized one. Pluggable backends. SciPy out of the box, GraphBLAS for acceleration, or NetworkX when you want interoperability - switchable without rewriting your analysis. Getting started The snippets below are written to be run interactively in a Jupyter notebook. Everything assumes a Spark session, which you can start up using the below QPython function: from qpython.qspark.spark import start_spark spark, _, _ = start_spark("qknowledgegraph") import qknowledgegraph as qkg Creating a graph There are several routes into QKG, depending on where your data is stored. The fastest way to get a real graph to play with is a generator. These write a proper graph to disk and hand you back a KnowledgeGraph: kg = qkg.generators.gen_individual_business_txn_graph("./data", director_density=0.1) That's it - you now have individuals, businesses and accounts, and multiple relationships between them. To reopen a saved graph later: kg = qkg.KnowledgeGraph.load("./data/simple-graph.kginfo", spark) You can also feed in the Quantexa Batch Resolver output. You need to point QKG at Batch Resolver outputs and declare which entities, edges and features you want to keep: import qknowledgegraph.ingest.qbatchresolver as qbr from qpython.qbatchresolver.batch_resolver import BatchResolver br = BatchResolver("path/to/batch_resolver/") kg = qbr.KnowledgeGraphCreator( qbr.NodeExtractor("business", F.col("isOnHotlist").cast("float")), # keep a feature qbr.RelationshipExtractor("relationship"), qbr.RelationshipExtractor("role", source="individual", target="telephone"), ).create(br, output_root="./data", graph_name="qbr", parquet_write_mode="overwrite") NodeExtractor and RelationshipExtractor - define which node types to keep, which features to carry over, and which edges to build. Using this information, KnowledgeGraphCreator(...).create(...) runs the ingest. Exploring a graph Let's first take a look at the generated knowledge graph. Running the following code snippet will sketch the graph's schema (every node type and the relationship types connecting them) as a diagram: from qknowledgegraph import viz viz.draw_metagraph_pydot(kg.metagraph) You can then explore the created knowledge graph by running the code below: kg.overview() # node & edge counts list(kg.entities) # node types [t.motif_string for t in kg.triplets] # relationship types This will print the summary of the graph, as you can see in the below image. Reshape it with Perspectives Most of the times, knowledge graphs are heterogeneous - they contain multiple types of nodes and edges. However, often only some nodes and edges may be relevant to your Knowledge Graph. For example, if you're tracing how money moves between people, the transaction edges are what you need and the address links are just noise; on the other hand, transactions may be irrelevant for analysing corporate hierarchies. Using the Quantexa’s patented Perspective technology, you can easily transform the graph via the metagraph, for example by collapsing a multi-hop path into a single derived relationship, then pruning down to just the nodes types you care about: def txn_path(src, dst): return [ qkg.Triplet(src, "owner", "account"), qkg.Triplet("account", "txn", "account"), qkg.Triplet(dst, "owner", "account").invert(), ] end_nodes = ["business", "individual"] transaction_paths = [txn_path(src, dst) for src in end_nodes for dst in end_nodes] mg = kg.metagraph.augment(*[("txn", path) for path in transaction_paths]).select(nodes=["business", "individual"], relationships=["txn"]) Similarly as above, by running the code viz.save_metagraph_pydot(mg, show_change_from=kg.metagraph, path="./mg_diff.png") viz.draw_metagraph_pydot(mg, show_change_from=kg.metagraph) you can visualize the metagraph of your transformed knowledge graph after augmentation and pruning, as shown below. You can finally save the new metagraph by running the below code perspective = kg.save_perspective(mg, name="perspective", output_root="./data") Rank the important nodes With a graph in hand, you can run complex algorithms such as PageRank, which gives you back the most relevant nodes (in this case individuals) in your graph. pagerank = qkg.PageRank(perspective).run() Now we print the top 5 most important individuals found with PageRank. top_individuals = ( pagerank.pandas().get("individual") .sort_values("pagerank", ascending=False) .head(5) .assign(entity_type="individual")[["entity_type", "graph_node_id"]] ) Build ego-networks EgoBuilder grows a neighbourhood outward from seed nodes, following a path query (head-relationship-tail, with * for "any" and | for "or"): ego = qkg.EgoBuilder(perspective).seed(top_individuals).expand("individual-*-business-*-individual") print(ego.explain()) # see the planned expansion before it runs nhds = ego.run("./data/nhds") # nothing runs until .run(); returns a Spark DataFrame The length of the path query controls how many hops the expansion travels from each seed. Each -relationship-node segment you chain on is one more hop outward: individual-*-business-*-individual is a two-hop expansion (individual → business → individual), whereas individual-*-business would stop after one. The more hops, the wider -- and more computationally expensive - the neighbourhood. Seeds can be a node type, a list of types, or a DataFrame - so you can, for example, seed the expansion with your top PageRank nodes. Ask questions in Cypher If you prefer a query language, CypherInterpreter runs OpenCypher-style MATCH ... RETURN queries over neighbourhoods: from qknowledgegraph.cypher import CypherInterpreter seeded = qkg.EgoBuilder(kg).seed("individual") CypherInterpreter(seeded).run( "MATCH (:individual)-[]->(biz:business)-[]->() RETURN biz.x1", neighborhood_transform=inject_business_features ) The neighborhood_transform parameter lets you inject the features (in this case business features), in order to extract the x1 feature. From Ego-networks to Scoring Graphs Ego-networks can be converted to NetworkX graphs for custom graph analysis, or to Quantexa ScoringGraph objects for the Assess scoring pipeline. from qknowledgegraph.neighborhood.scoring import neighborhood_df_to_scoring_graphs scoring_graphs = neighborhood_df_to_scoring_graphs( nhds, output_path="./data/scoring_graphs", mode="overwrite" ) scoring_graphs.scoring_graph.show(5, truncate=True) The ego-networks around our highest PageRank individuals are now Quantexa Scoring Graphs, ready for network scoring rules in an Assess pipeline. Summary This article is a brief introduction of QKnowledgeGraph: we explored from why modelling connections with graph matters to what QKG is, and how you actually build and explore one. We saw that QKG turns Quantexa's resolved entities into graphs where you can do data science, at scale, within the Python ecosystem.43Views0likes0Comments
📖Decision Making Beyond Local Graph Context
When investigating an Entity in the Quantexa Graph, how do you ensure you're not missing critical context? Expanding through the Graph can reveal important connections, but going too far can lead to information overload. This new article by explores how Multi-hop Graph Analysis helps investigators uncover hidden relationships by analyzing the Graph in its entirety—beyond just proximity. Using Quantexa’s Knowledge Graph framework, Matt explores an example of how this approach identified 65 new Entities linked to financial crime that weren’t flagged in public investigations. 🔎 Learn how Multi-hop Graph Analysis enhances investigations, from AML to risk management and beyond. 📖 Read the full article: Decision making beyond local Graph context - Quantexa Community Background When investigating an Entity in the Quantexa Graph, it is common for an investigator to start from the Entity in question, and expand through the Graph along related documents and Entities to find relevant linked information. This is standard practice in many contexts, for example in various risk applications,… You can also watch the webinar recording to hear from Matt directly: How Knowledge Graphs Help Identify Bad Financial Actors and Commercial Opportunities at Scale In this session, you’ll learn how multi hop graph techniques explore proximity and paths to illuminate relationships and communities of interest.
5 Key Insights from the Webinar Bringing Knowledge Graphs to Life
Here are five key insights in case you missed the recent Quantexa webinar, Bringing Knowledge Graphs to Life 1. Introducing Knowledge Graphs The webinar gave a comprehensive introduction to knowledge graphs and why they’re hot right now. , , , and delved into how knowledge graphs, enabled through improved technology, bring a profound representation of entities and their relationships at scale, fostering great opportunities for impactful analysis and visualization. Knowledge graphs are applied in different ways, for graph analytics, semantic encoding, and delivering context to Large Language Models (LLMs) in AI. 2. Advantages and Challenges of knowledge graphs While there are numerous advantages of knowledge graphs, there are challenges on the journey. Depending on where and how data is sourced, knowledge graphs can be incomplete. The team emphasized the critical necessity of data quality and efficient entity resolution, because any failures diminish the ability to extract accurate and novel insights. Also, as knowledge graphs are normally very large, that compounds the need for accurate entities given the storage and compute investment, but also brings challenges of interacting with, visualizing and analyzing graph information, as Aaron noted, important for data scientists. 3. Is a Graph Database Needed? The panel noted the perceived intersection of knowledge graphs with graph databases, a domain well-marketed by graph database vendors. Ben remarked on how graph databases efficiently store and query knowledge graph data, but as knowledge graphs adapt with your organization’s data and needs, it’s important not to lock information away and be constrained by a single database. Ana highlighted how knowledge graphs can and should work across your organization’s data platforms and software. Aaron noted how data scientists, who thrive on iterative ad-hoc investigation and batch processing, benefit from direct access to knowledge graph structures. 4. Practical Implementation of knowledge graphs Knowledge graphs can be implemented across a wide spectrum of industries ranging from drug discovery to telecommunications and supply chains, and into functions like risk modeling, fraud detection, sales and marketing opportunities. Whatever the use case, it’s only a hop, skip and a jump from mainstream “tabular thinking” to “thinking graph,” given the elevation of expanded relationship information, i.e., edges, across entities, i.e. nodes. 5. Transformational Effects of knowledge graphs The panelists shared how knowledge graph technology had revolutionized their respective roles before and during their time at Quantexa. Ana pointed to the innovation opportunities leading to increased work satisfaction. Ben too appreciated how knowledge graphs unraveled unique solutions and allowed them to tackle complex problems. Steve pondered how the evolution of computational knowledge can drive change and unlock value across decision-making, science and engineering. This webinar is well worth watching to learn about the increasingly prominent role of knowledge graphs in data analysis, AI and decision-making. View the full webinar recording at Bringing Knowledge Graphs to Life Explore QKnowledgeGraph capability in the Quantexa Documentation582Views0likes0Comments